
The Yarta Report
One score. Ten categories. A roadmap to improvement.
The Yarta Report is an environmental sustainability report for each period and a live dashboard, built on the Yarta Method: your data evaluated against the eco standards, benchmarked against your industry, compared with your targets and your last period, and closed with the suggestions and the plan by quarter.
The product family
One report. Six ways to read it.
Every product below is a view of the same record. Nothing is calculated twice and nothing is calculated differently.
- 01
Yarta Report
Three A4 pages for each period
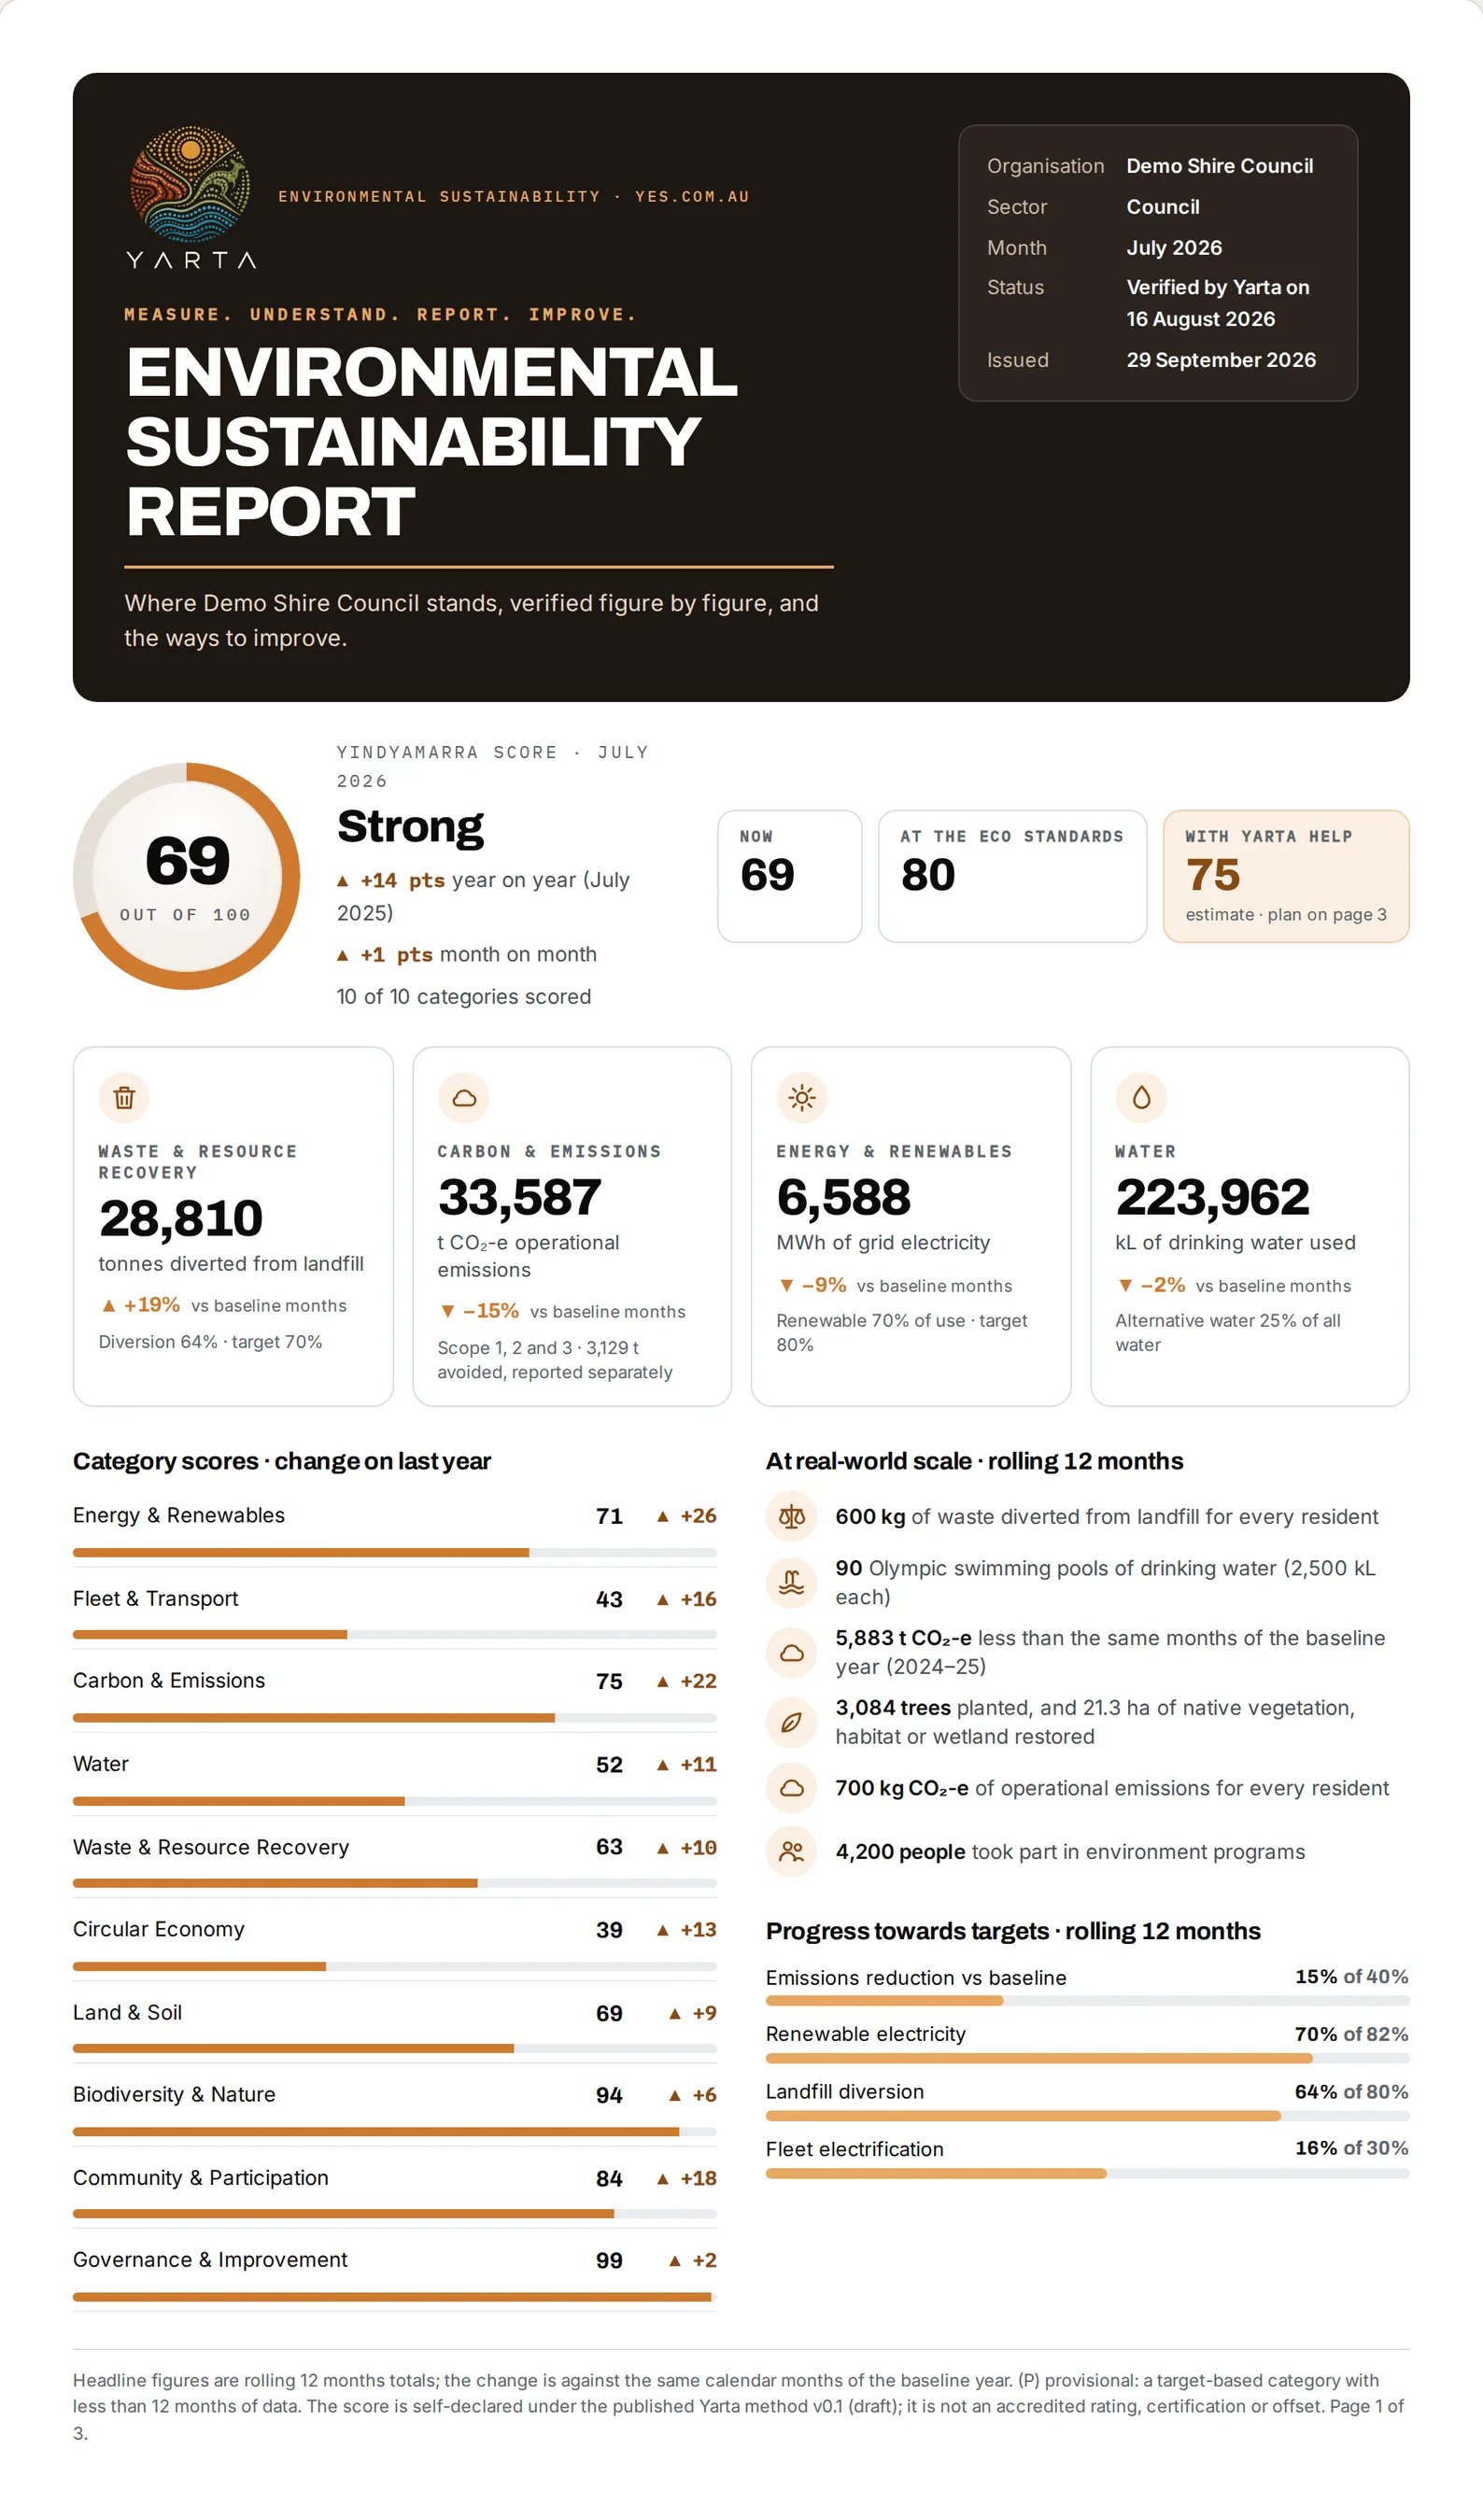
Page one measures: the Yindyamarra Score with its band and the change on last year, where you could be, four headline figures against the baseline, the ten category scores, real-world scale and progress towards the eco standards. Page two is the figures behind the score, with the evidence grade for each. Page three is the roadmap to improvement. The products below are its parts.
Sample report → - 02
Yarta Dashboard
Live reporting portal
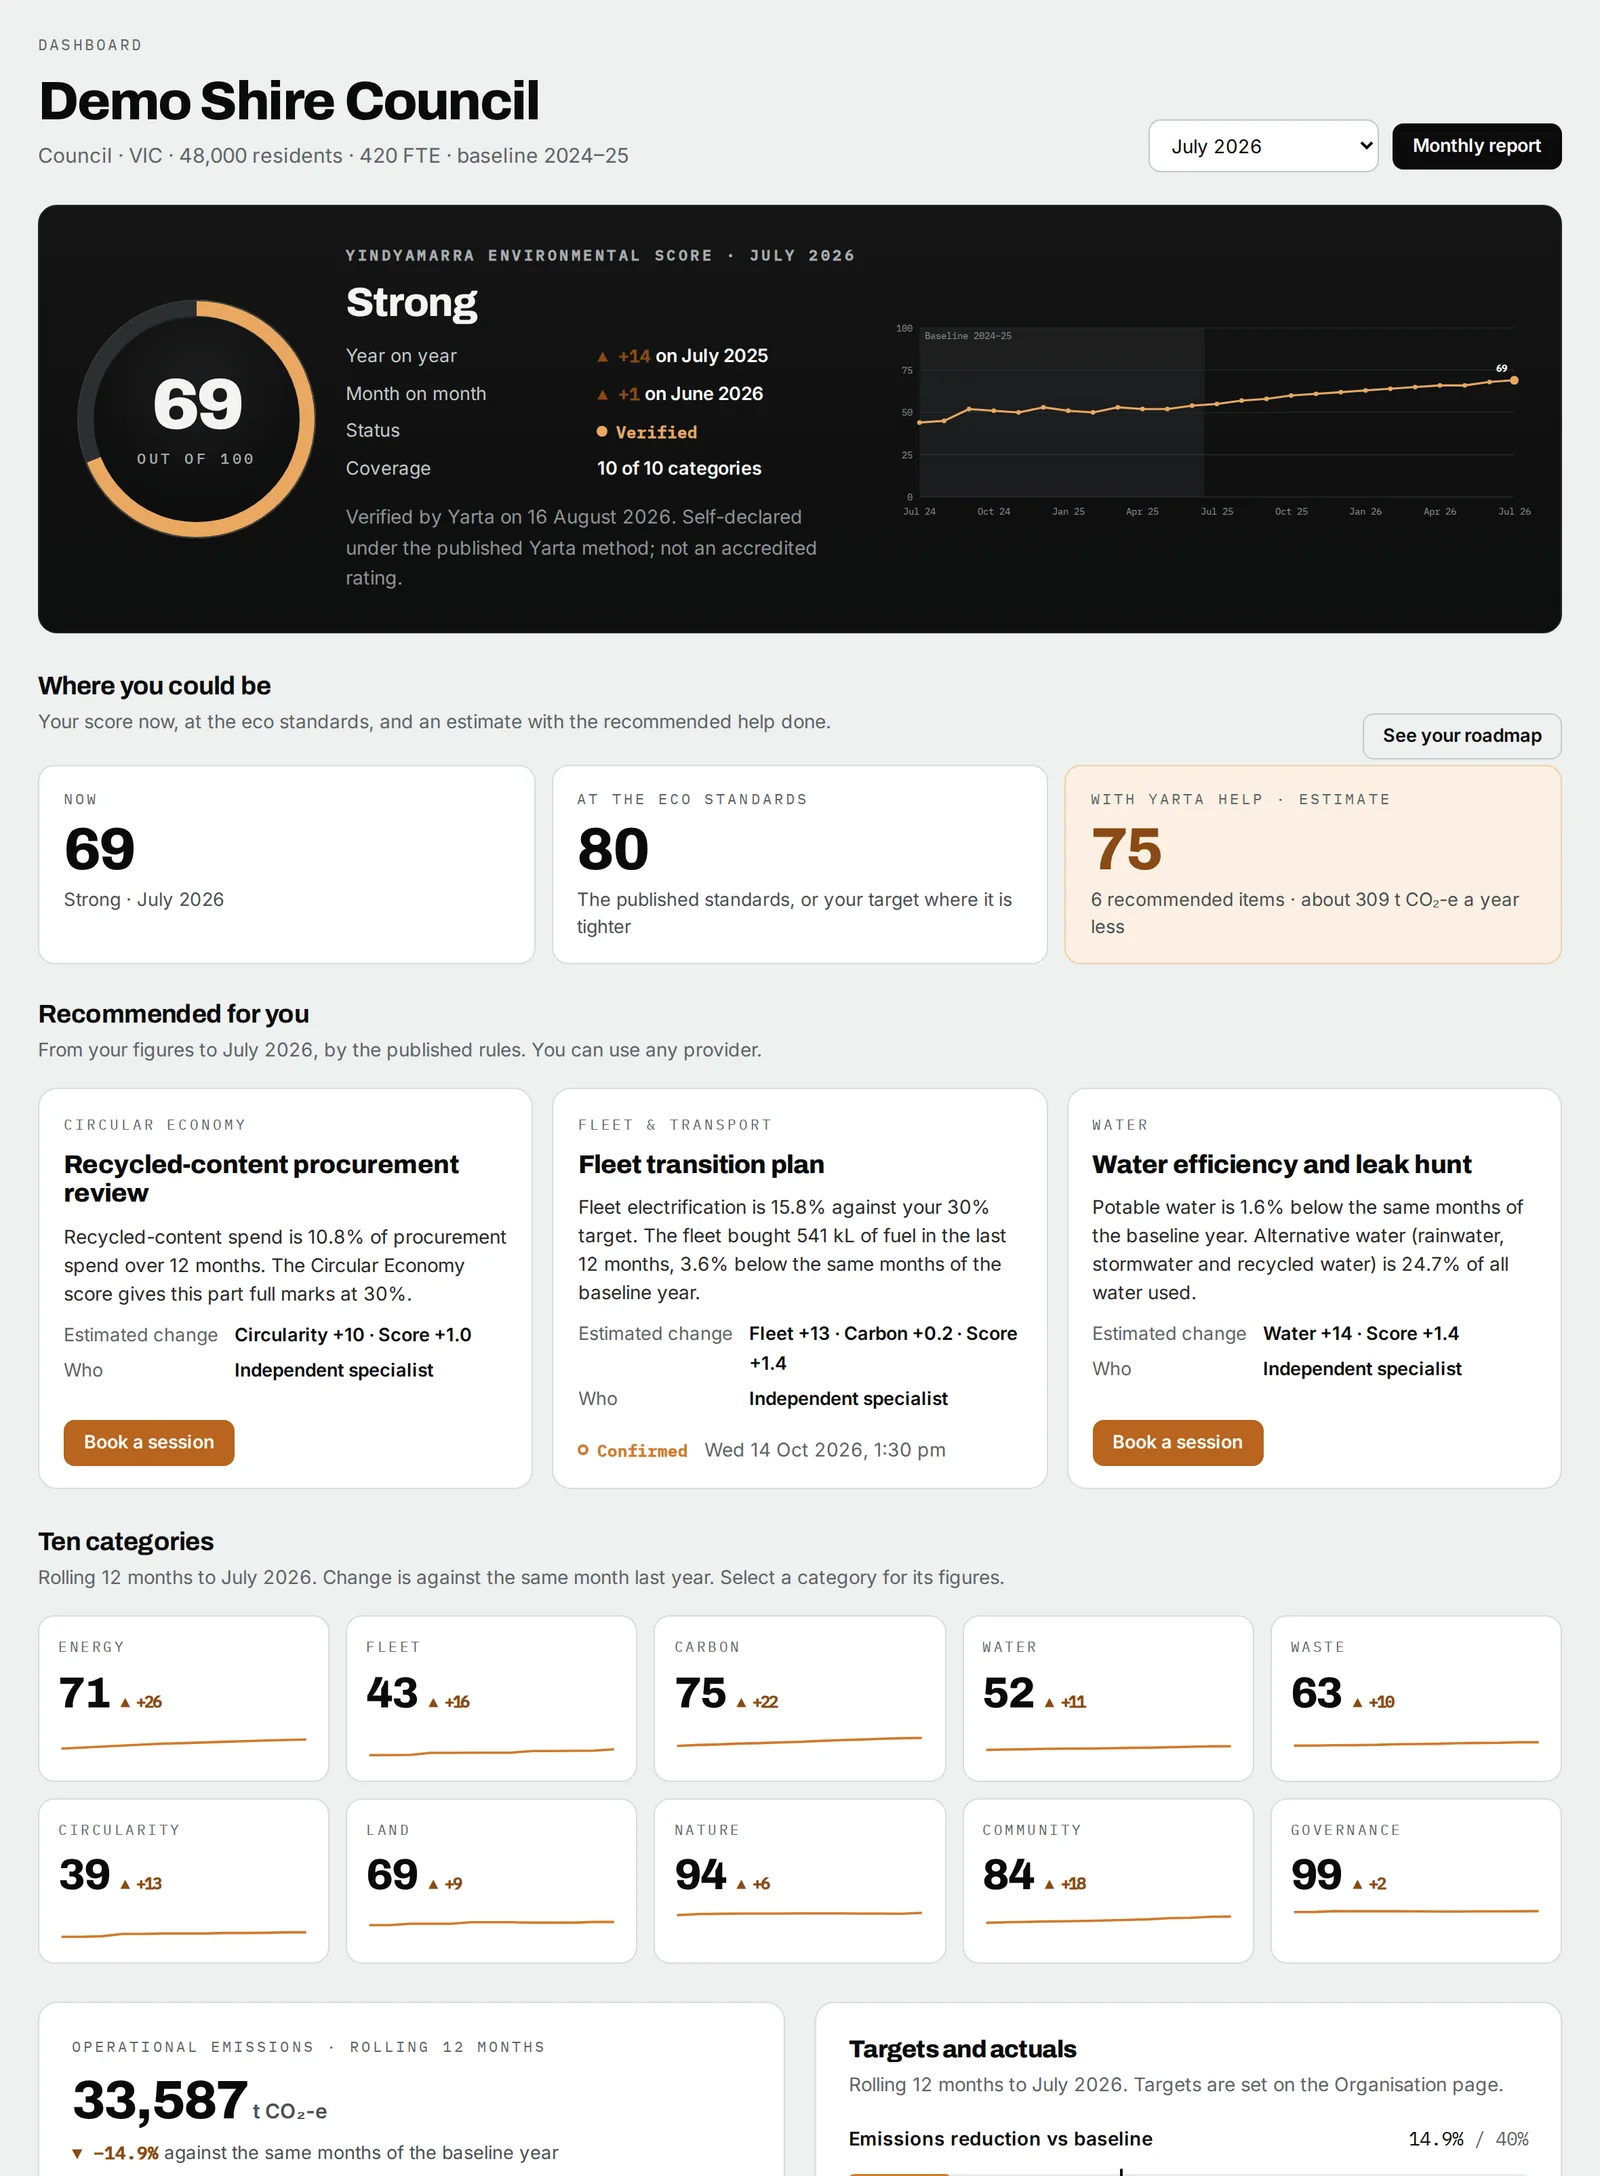
The score, where you could be, the suggestions, the ten category tiles with drill-downs, emissions by scope, targets against actuals, the documents you sent and what Yarta still needs for the month.
- 03
Yarta Roadmap
Roadmap to improvement
The score now, at the eco standards and with Yarta help; suggestions ranked by what would move the number, each bookable; the plan by quarter; and the change since work was done, shown as a change, not a cause.
- 04
Yarta Data
The figures behind every number
Every figure with its month, source document, evidence grade and the analyst who entered it, exportable as CSV or JSON. The data dictionary lists every field you enter and every figure Yarta calculates.
- 05
Yarta Carbon
Scope 1, 2 and 3 · avoided emissions separate
Operational emissions with the National Greenhouse Accounts factors, by scope and by month, ready for mandatory climate reporting. Avoided emissions from recovered material are estimated with their own factors, reported separately and never netted.
- 06
Yarta Benchmark
Compare
Your score against the eco standards, the published benchmarks for your industry, your own targets and your last period, category by category. The industry benchmarks are printed on the report with their source and period, for example 41% of municipal waste recycled across NSW councils in 2024–25, or 81% of construction and demolition waste recovered nationally. They come from public sources for your sector, never from other Yarta customers: your data is not shared, and nobody else's is shown to you. The current benchmark table →
The Yindyamarra Score
One number a board can read. Ten categories an auditor can check.
A score out of 100 for each month, the average of the categories you report. Each category is scored 0 to 100 from its own figures against the eco standard or your target. A category you don't report is left out, not scored zero. Self-declared under the published method, versioned, and never an accredited rating or certification.
How a category is scored
- Energy: 60% renewable share, 40% grid electricity against your baseline.
- Fleet: 60% electrification (full marks at 50% of the fleet), 40% fuel against your baseline.
- Carbon: rolling 12-month emissions against the same months of the baseline year, towards your reduction target.
- Water: 50% alternative water share (full marks at 50%), 50% potable use against your baseline.
- Waste: 70% landfill diversion, 30% contamination.
- Circularity: 50% recycled-content procurement share (full marks at 30%), 30% reuse, 20% stewardship programs.
- Land: hectares rehabilitated against your annual target.
- Nature: 50% trees planted, 50% hectares restored, each against your target.
- Community: participants against your annual target.
- Governance: 50% data completeness, 30% evidence share, 20% complaints closed.
Beside the score sit two more numbers: the score at the eco standards, and an estimate with the suggested help done. Both are calculated with the same function as the score itself, so they can never disagree with it. The rules and weights are on the method page and the standards on the eco standards page.
The dashboard
Environmental sustainability, live.
The Yindyamarra Score, where you could be, the suggestions, the ten category tiles, emissions by scope and targets against actuals, recalculated as each month you enter is verified.
The report
A summary page. Every figure with its method.
Issued for each reporting period. A board, a councillor or an auditor can read page one in a minute and trace any number on it to the figures on page two.
WHAT IS ON THE REPORT
Demo data · illustrativeThe downloadable layer. Three A4 pages: the score and what sits behind it, the figures with an evidence grade for each, and the roadmap to improvement. Every figure carries the method version it was calculated under, so it can be reproduced later.
- Period, organisation and sector
- Yindyamarra Score, band, and change on last year and last month
- Where you could be: now, at the eco standards, with Yarta help
- Four headline figures against the baseline months
- Ten category scores with change on last year
- Real-world scale: per bed, student, resident, site or employee
- Progress towards the eco standards
- Emissions by scope · avoided emissions reported separately
- Key figures by category with unit and note
- Data completeness, evidence share and evidence grades
- Projected score with the plan
- Suggestions, ranked, with provider disclosed
- Plan by quarter and progress so far
- Method version, assumptions and disclosures
Exports and integrations
Built to leave the dashboard.
The figures are yours. Every export carries the evidence reference and the method citation, so the number in your annual report is the number on the ledger.
- CSV of every ledger entry. Date, stream, quantity, bucket, evidence grade, evidence reference and the operator's initials.
- PDF report. The Yarta Report for the period, print-ready.
- Scope 3 export. Waste generated in operations, mapped to GHG Protocol Scope 3 Category 5: mass, treatment, factor, NGA edition and method for every line. Avoided emissions travel in a separate table.
- Annual report figures. Tonnes by fate, steel, landfill avoided and both emissions figures as a citable table, each with its Yarta Method reference and the wording to use.
- API access. Read access to your ledger and tiles for your own systems. Roadmap
Evidence-based, not marketing-based. No trees saved. Every equivalence shown with its source.
The Category 5 figure uses the government's NGA landfill factors with supplier-specific processing data. Avoided emissions use NSW DECCW 2010 factors, flagged for refresh, and are reported separately: never deducted, never an offset. Streams with no avoided-emissions factor are reported as recovered tonnes with no estimate, and are marked as pending on the report.
The difference
A tonnage line is not a report.
Most organisations already receive a number from their contractor. The question is what it can support.
A contractor's tonnage report
- One figure per invoice, entered by the contractor
- A diversion percentage with no method behind it
- No evidence reference a reader can follow
- No carbon figure, or one without a source
- A different format from every contractor
- Nothing that survives an auditor's question
The Yarta Report
- Every handover entered and verified by Yarta
- Three buckets, and Stored never counts as recycled
- An evidence reference and operator's initials on every entry
- An inventory figure and an avoided figure, never netted, each with its source
- One method across every stream and every contractor
- A report ID and a method version that can be reproduced
Switched on in 30 days
See your Yarta impact before you commit.
Book a 30-minute walkthrough with the demo dashboard, or enter one month of your figures and see what Yarta makes of them.