
For councils
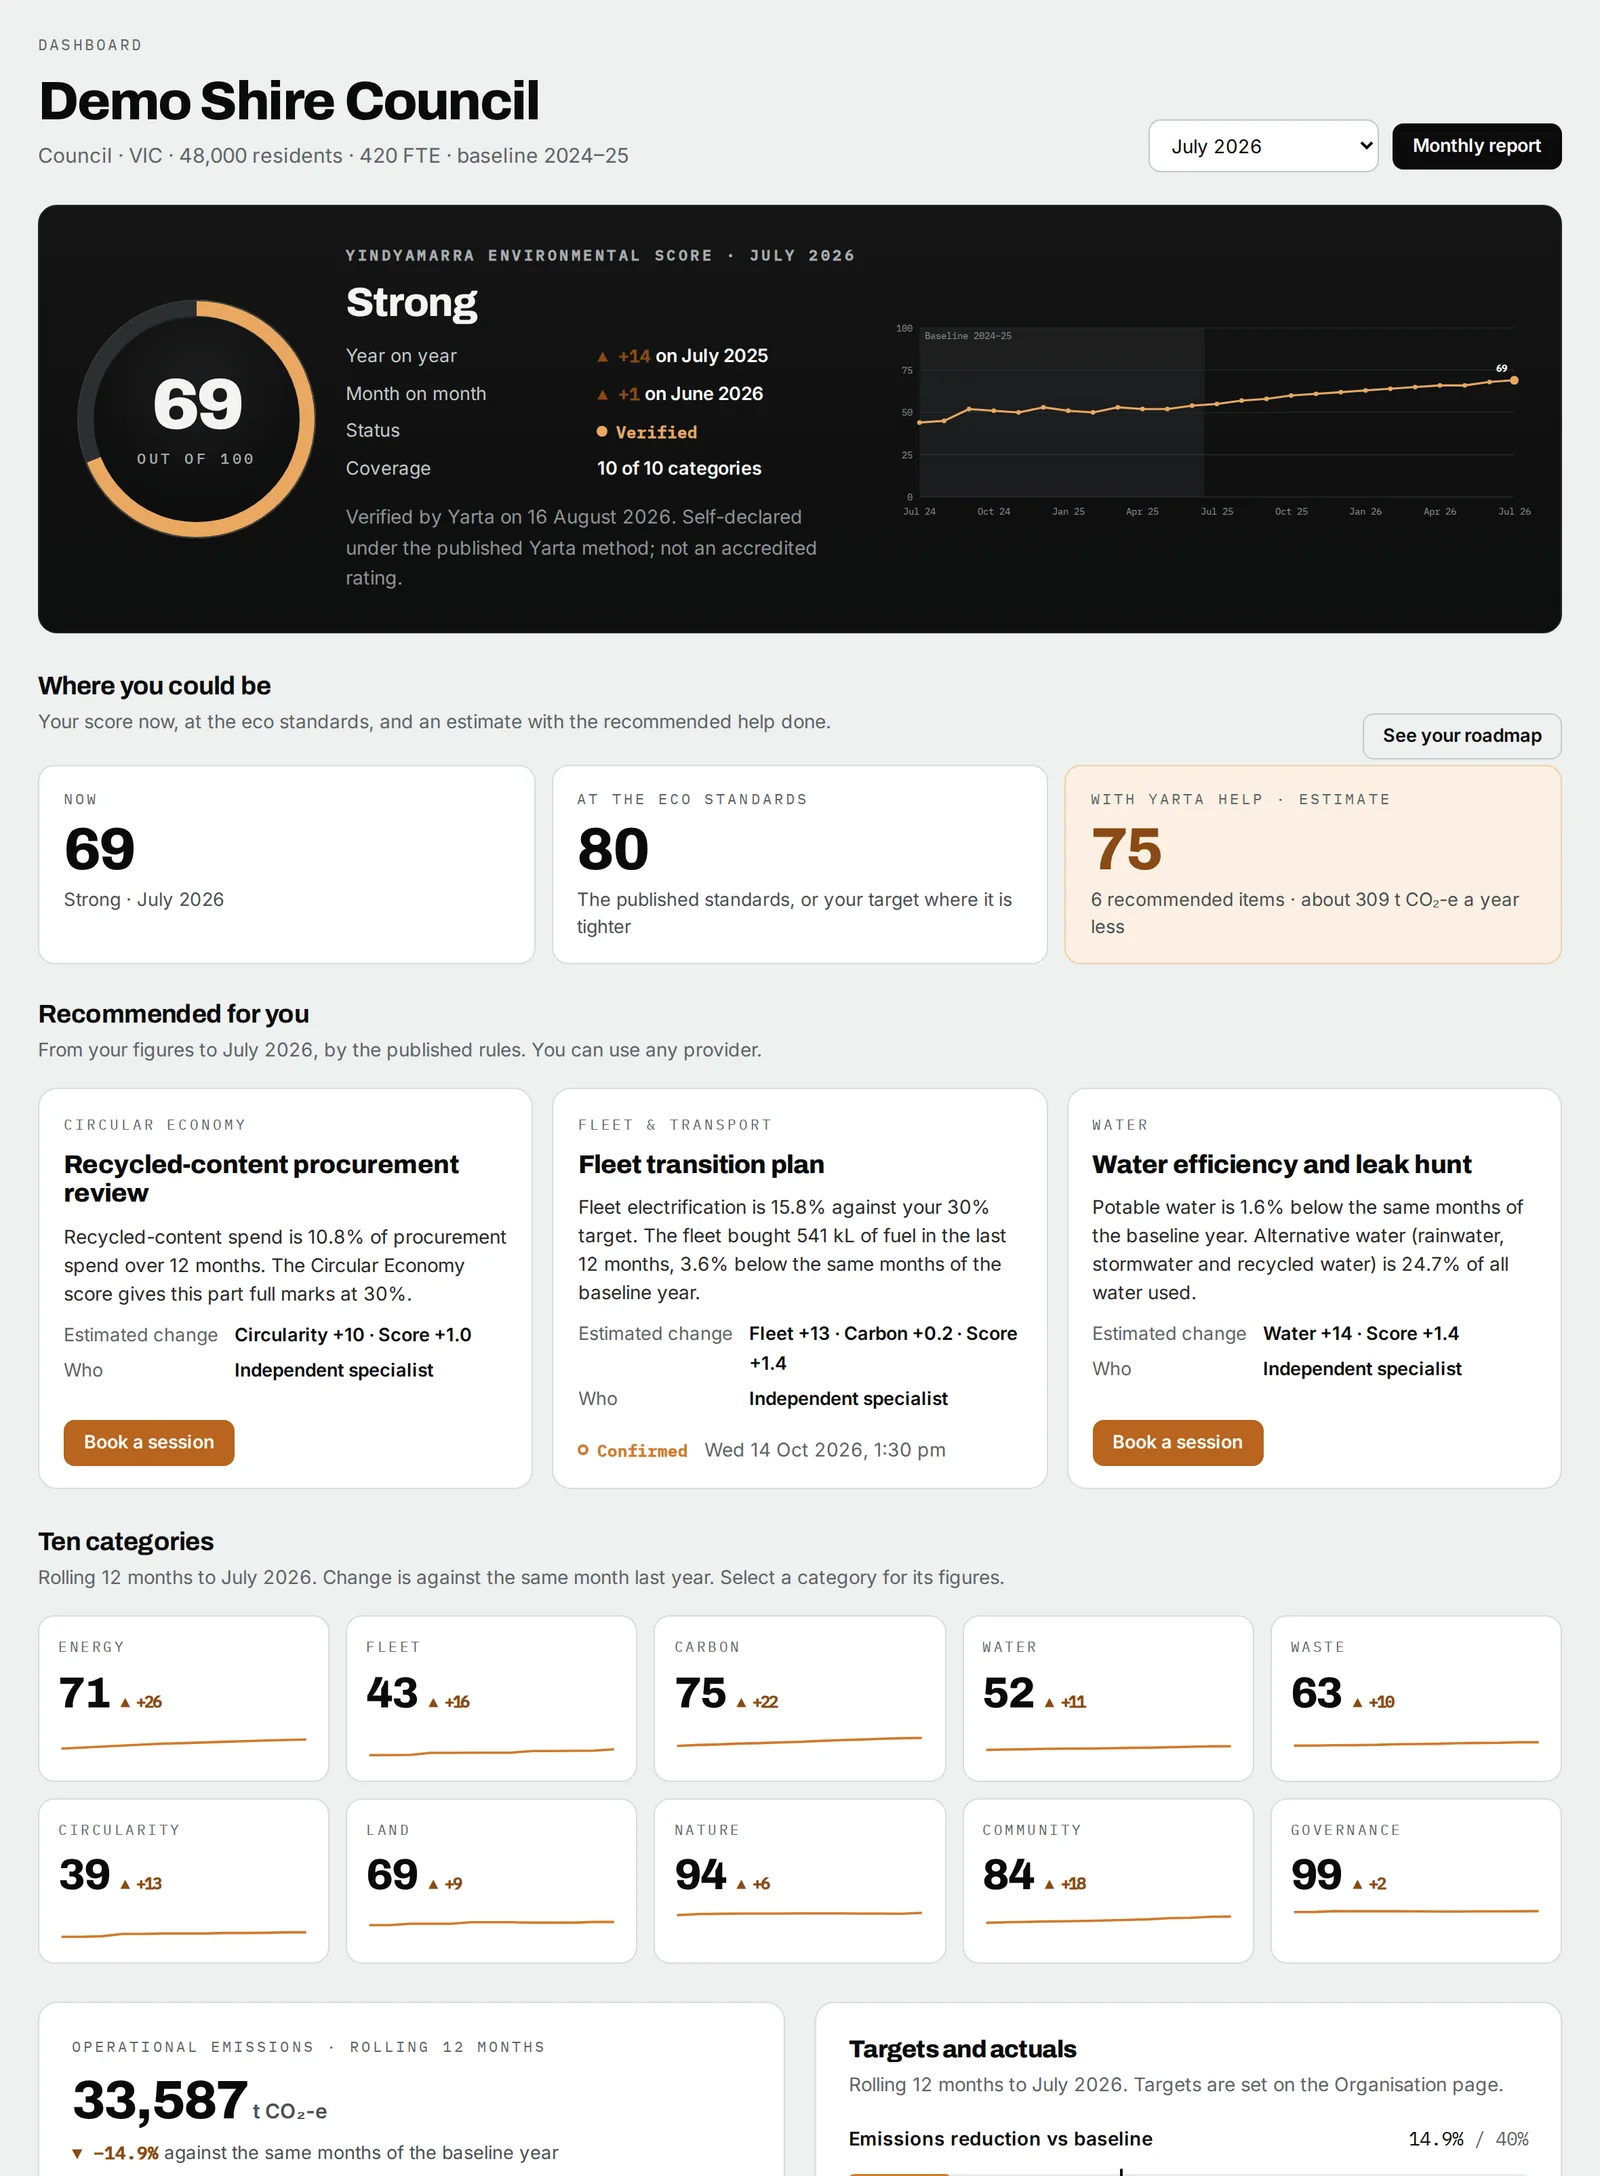
One score for the whole council.
The kerbside service, transfer stations, depots, buildings, pools, fleet, water, parks and Country, community programs. Yarta turns the records you already hold into one score against the eco standards, and a roadmap to improvement a councillor, a resident and an auditor can all read.
The reporting problem
The data sits in six departments. The score doesn't exist.
Waste has the contractor reports, fleet has the fuel cards, facilities has the bills, parks has the planting records. Nobody holds one number for the council, and nobody can say what would move it.
What you get today
- Tonnage lines on contractor invoices, bills in a drawer, a fleet register nobody reconciles
- A diversion percentage with no method behind it
- An environment strategy with targets and no measurement against them
- Nothing that survives an audit or a council meeting
- No plan for what to do first
With Yarta
- One score across ten categories, from the records you already hold
- Every figure evaluated against the eco standards and your own targets
- A Yarta Report each period, with the roadmap to improvement
- A dashboard for the sustainability team, a page for the community
- Figures cited by method version in the annual report
What Yarta reports
Every stream a council handles, on one dashboard.
Ten categories, more than thirty waste streams, one method. Whatever the program, the number is built the same way and traced the same way.
The ten categories
WHAT A COUNCIL SENDS
Demo data · illustrativeThe waste service
Kerbside garbage, recycling, organics and glass; transfer station streams; hard waste; contamination from bin audits. Contractor reports and weighbridge dockets are the evidence, and more than thirty streams are recognised.
Open the council demo →Buildings, fleet and water
Electricity and gas for buildings, pools and streetlighting; fuel cards, kilometres and the fleet register; water bills and alternative water. Bills and statements are the evidence.
Country and community
Land rehabilitated, trees planted, habitat and wetland restored, environmental programs and the people who took part, complaints and incidents closed. Project and planting records are the evidence.
How the data gets in →
Switched on in 30 days
Four weeks from scoping to a live dashboard.
Onboarding is scoped, not open-ended. By the end of week four your first months are entered, the dashboard is live and the first monthly email is scheduled.
Proposed schedule
Week 1
Scope and boundary
Sites, services, fleets and programs in the boundary; the categories in play; who holds each record.
Week 2
Baseline, targets and standards
The baseline year is set, your targets are entered against the eco standards, and the method sheet is agreed: factors and streams, each with its status.
Week 3
First months entered
You enter the baseline months from the records you hold, or send Yarta a spreadsheet to load, and Yarta verifies and grades them. The record starts.
Week 4
Dashboard live, first roadmap
Every tile calculating. The first suggestions are on the roadmap and the first monthly email is scheduled.
Proposed schedule. Subscription applies from the switch-on date.
What the council receives
- Yarta Dashboard access. For the sustainability team, with every category on one screen.
- Monthly email. What Yarta needs for the month, and what is still missing.
- Yarta Report each period. The score, the figures and the roadmap to improvement, with the method version.
- CSV and PDF exports. Every figure and the full Yarta Report.
- Method pack. The factor library, sources and change log, so an auditor can follow any figure back.
- Named Yarta data operator. One person who enters your data and answers for it.
Pricing for councils
One monthly fee, set by population.
An annual subscription, priced by the month. No per-report charges. The establishment fee is waived for Foundation Members who join in the first 12 months.
The establishment fee is normally $5,000 to $15,000 and covers scoping, streams, the baseline, the method sheet and onboarding. Foundation Members who join in the first 12 months pay none of it. The monthly fee applies from the switch-on date.
| Resident population | Monthly fee |
|---|---|
| Up to 50,000 | $1,999 a month |
| 50,000–100,000 | Priced on application |
| 100,000–200,000 | Priced on application |
| 200,000–300,000 | Priced on application |
| 300,000+ | Priced on application |
Proposed pricing. One tier is priced today; the bands above it are priced on application while the first council programs are scoped.
Report-ready
An evidenced number for the annual report, the tender and the councillor.
Every figure on a Yarta Report carries its evidence grade, its eco standard and its method version, so it can be cited in the annual report, a tender response or a contract KPI without re-checking.
- Annual and tender reporting. The Yindyamarra Score, the ten category scores, tonnes by stream, energy, water and fleet for the period, and the emissions figures, each with its Yarta Method reference.
- Contract KPIs and benchmarks. Diversion, contamination and evidence share per contractor, calculated the same way for every contractor and set against the eco standards and the industry benchmark for councils of your size.
- Evidence grades. Grade A, B or C on every entry, so a reader can see what a figure rests on before they rely on it.
- Method versioning. The version is printed on the report. The figure can be reproduced later even if the factor library has moved on.
- Exports. CSV of the ledger, the Yarta Report as a PDF, and a citable table for the annual report.
One method across every department and every contractor. That is what makes the numbers comparable, year on year and against the eco standards.
The Yindyamarra Score and the evidence grades are self-declared under Yarta's own published method, versioned. They are not an accredited rating, certification or third-party verification. Where a category needs accredited work to improve, the roadmap names the kind of provider. Read the Yarta Method →
Questions councils ask
Straight answers.
The questions waste teams and finance teams ask first.
Do we enter the data ourselves?
No. You enter the figures you already hold and Yarta verifies them. Your named Yarta data operator enters every figure against the contractor report, the energy or water bill, the fuel-card statement, the planting record or the invoice you supply, and the entry carries an evidence reference and a grade. That is what makes the report credible to an auditor, a councillor or a resident.
What if we cannot supply a figure for a category?
The category is marked "not reported" and left out of the score; the score is the mean of the categories you do report. Once a month the fill-in-the-gaps email lists every stream and category we cannot yet account for. You enter what you have, we verify it, and the evidence you attach decides its grade. A bill or weighbridge record is grade A; a contractor report is grade B; a stated figure is grade C and is flagged.
Who are we benchmarked against?
The eco standards first: the national targets for waste recovery, emissions and renewable electricity, and your own targets where no national standard exists. Then the published industry benchmark for councils, drawn from public sources such as state waste data and national reports, never from other Yarta customers. Your data is not shared with any other organisation, and no other organisation's data is shown to you.
Is the Yindyamarra Score an accredited rating?
No. The Yindyamarra Score is self-declared under Yarta's own published method, versioned with the Yarta Method and shown in full: the mean of the ten category scores you report, each with its rule and weights stated. It is proposed at v0.1. It is not an accredited rating, certification or third-party verification, and is never presented as one. Where a category needs accredited work, the roadmap points you to the right accredited provider.
How are the emissions figures calculated?
Scope 1 and 2 from your fuel and electricity records, and the Scope 3 categories you report, all at the National Greenhouse Accounts factors for the year. The rolling 12 months is compared with the same months of your baseline year and with your reduction target. Avoided emissions from recycling are shown separately as an estimate and never deducted from the inventory. Every factor, source and version is on the Yarta Method page.
Can we show this to residents?
Yes. The Yarta Report can be published as issued, and the annual report can cite its figures by method version. A community view of the dashboard, so residents can see the council's score and what changed this year, is on the roadmap. Roadmap
More answers: questions we are asked · Yarta and the alternatives · what we will ask you for · glossary.
Switched on in 30 days
See your Yarta impact before you commit.
Book a 30-minute walkthrough with the demo dashboard, or enter one month of your figures and see what Yarta makes of them.