
For business
Environmental data your sustainability report can stand on.
Yarta gives sustainability, procurement and facilities teams one score across energy, fleet, emissions, water, waste and procurement, with a documented method for every calculation, the Scope 1, 2 and 3 figures ready for mandatory climate reporting, and a roadmap to improvement.
Mandatory climate reporting
Your first Scope 3 year may already be running.
Under Australia's mandatory climate reporting, Scope 3 is reported from each company's second year and reviewed by an auditor. Waste goes into that number wherever it is material.
Where the numbers go
Ten places an evidenced environmental figure is needed.
One record of your energy, fleet, water, waste, land and community data feeds every one of them. Nothing is calculated twice and nothing is calculated differently.
- Environmental reporting. The Yindyamarra Score and the ten category scores, with the figures behind each, by site and in total.
- Sustainability reporting. Period-on-period movement with the method held constant.
- ESG reporting. Figures with a source, a factor version and an evidence reference on every line.
- Procurement reporting. What your waste, energy and fleet suppliers delivered, measured the same way for each.
- Targets and eco standards. Every category against your target and the published eco standard, updated the month the data lands.
- Circular-economy initiatives. Recycled-content procurement, reuse and stewardship programs, and the tonnes recovered by stream.
- Internal environmental KPIs. The Yindyamarra Score and the headline tiles, per site or per period.
- Customer and stakeholder reporting. A Yarta Report that can be handed over as issued.
- Annual sustainability reports. A citable table with the Yarta Method reference for each figure.
- Supplier performance reporting. Evidence share and category performance per supplier, against the industry benchmark.
Carbon · Scope 1, 2 and 3
The emissions figure your auditor will ask about. Built line by line.
Yarta calculates Scope 1 from your fuel, Scope 2 from your electricity and the Scope 3 categories you report, including waste generated in operations (Category 5), at the National Greenhouse Accounts factors for the year. It records what an assurance provider expects to see behind each line.
What is recorded
Every month is recorded as the figures behind it: kilowatt hours and the renewable share, litres of fuel by type, kilolitres of water, tonnes by waste stream and the pathway each took. Each entry carries an evidence reference, a bill, fuel-card statement, meter read, weighbridge record or contractor report, and the grade that evidence earns.
Each figure is converted with the published factor for the year: fuel and electricity at the National Greenhouse Accounts factors, landfilled tonnes at the NGA landfill factor for the waste type. The factor edition is pinned to every line, so earlier figures stay reproducible after the library moves.
The rolling 12 months is compared with the same months of your baseline year and with your reduction target, which is how the Carbon score is set. Avoided emissions from recycling are calculated too, from published factors, and reported beside the inventory figure, never deducted from it. That is the separation the GHG Protocol asks for, and the one an assurance provider will check first.
The carbon export is the table an assurance provider expects: activity, quantity, factor, source and version, line by line, with the evidence reference beside each.
Designed to support Scope 1, 2 and 3 reporting and third-party assurance. Yarta does not certify compliance with any assurance standard. It supplies the evidence, the method and the export. Where a figure sits in your inventory depends on your reporting boundary.
Evidence-based
Evidence-based, not marketing-based.
An environmental figure in an ESG report will be questioned. The question is whether there is anything underneath it.
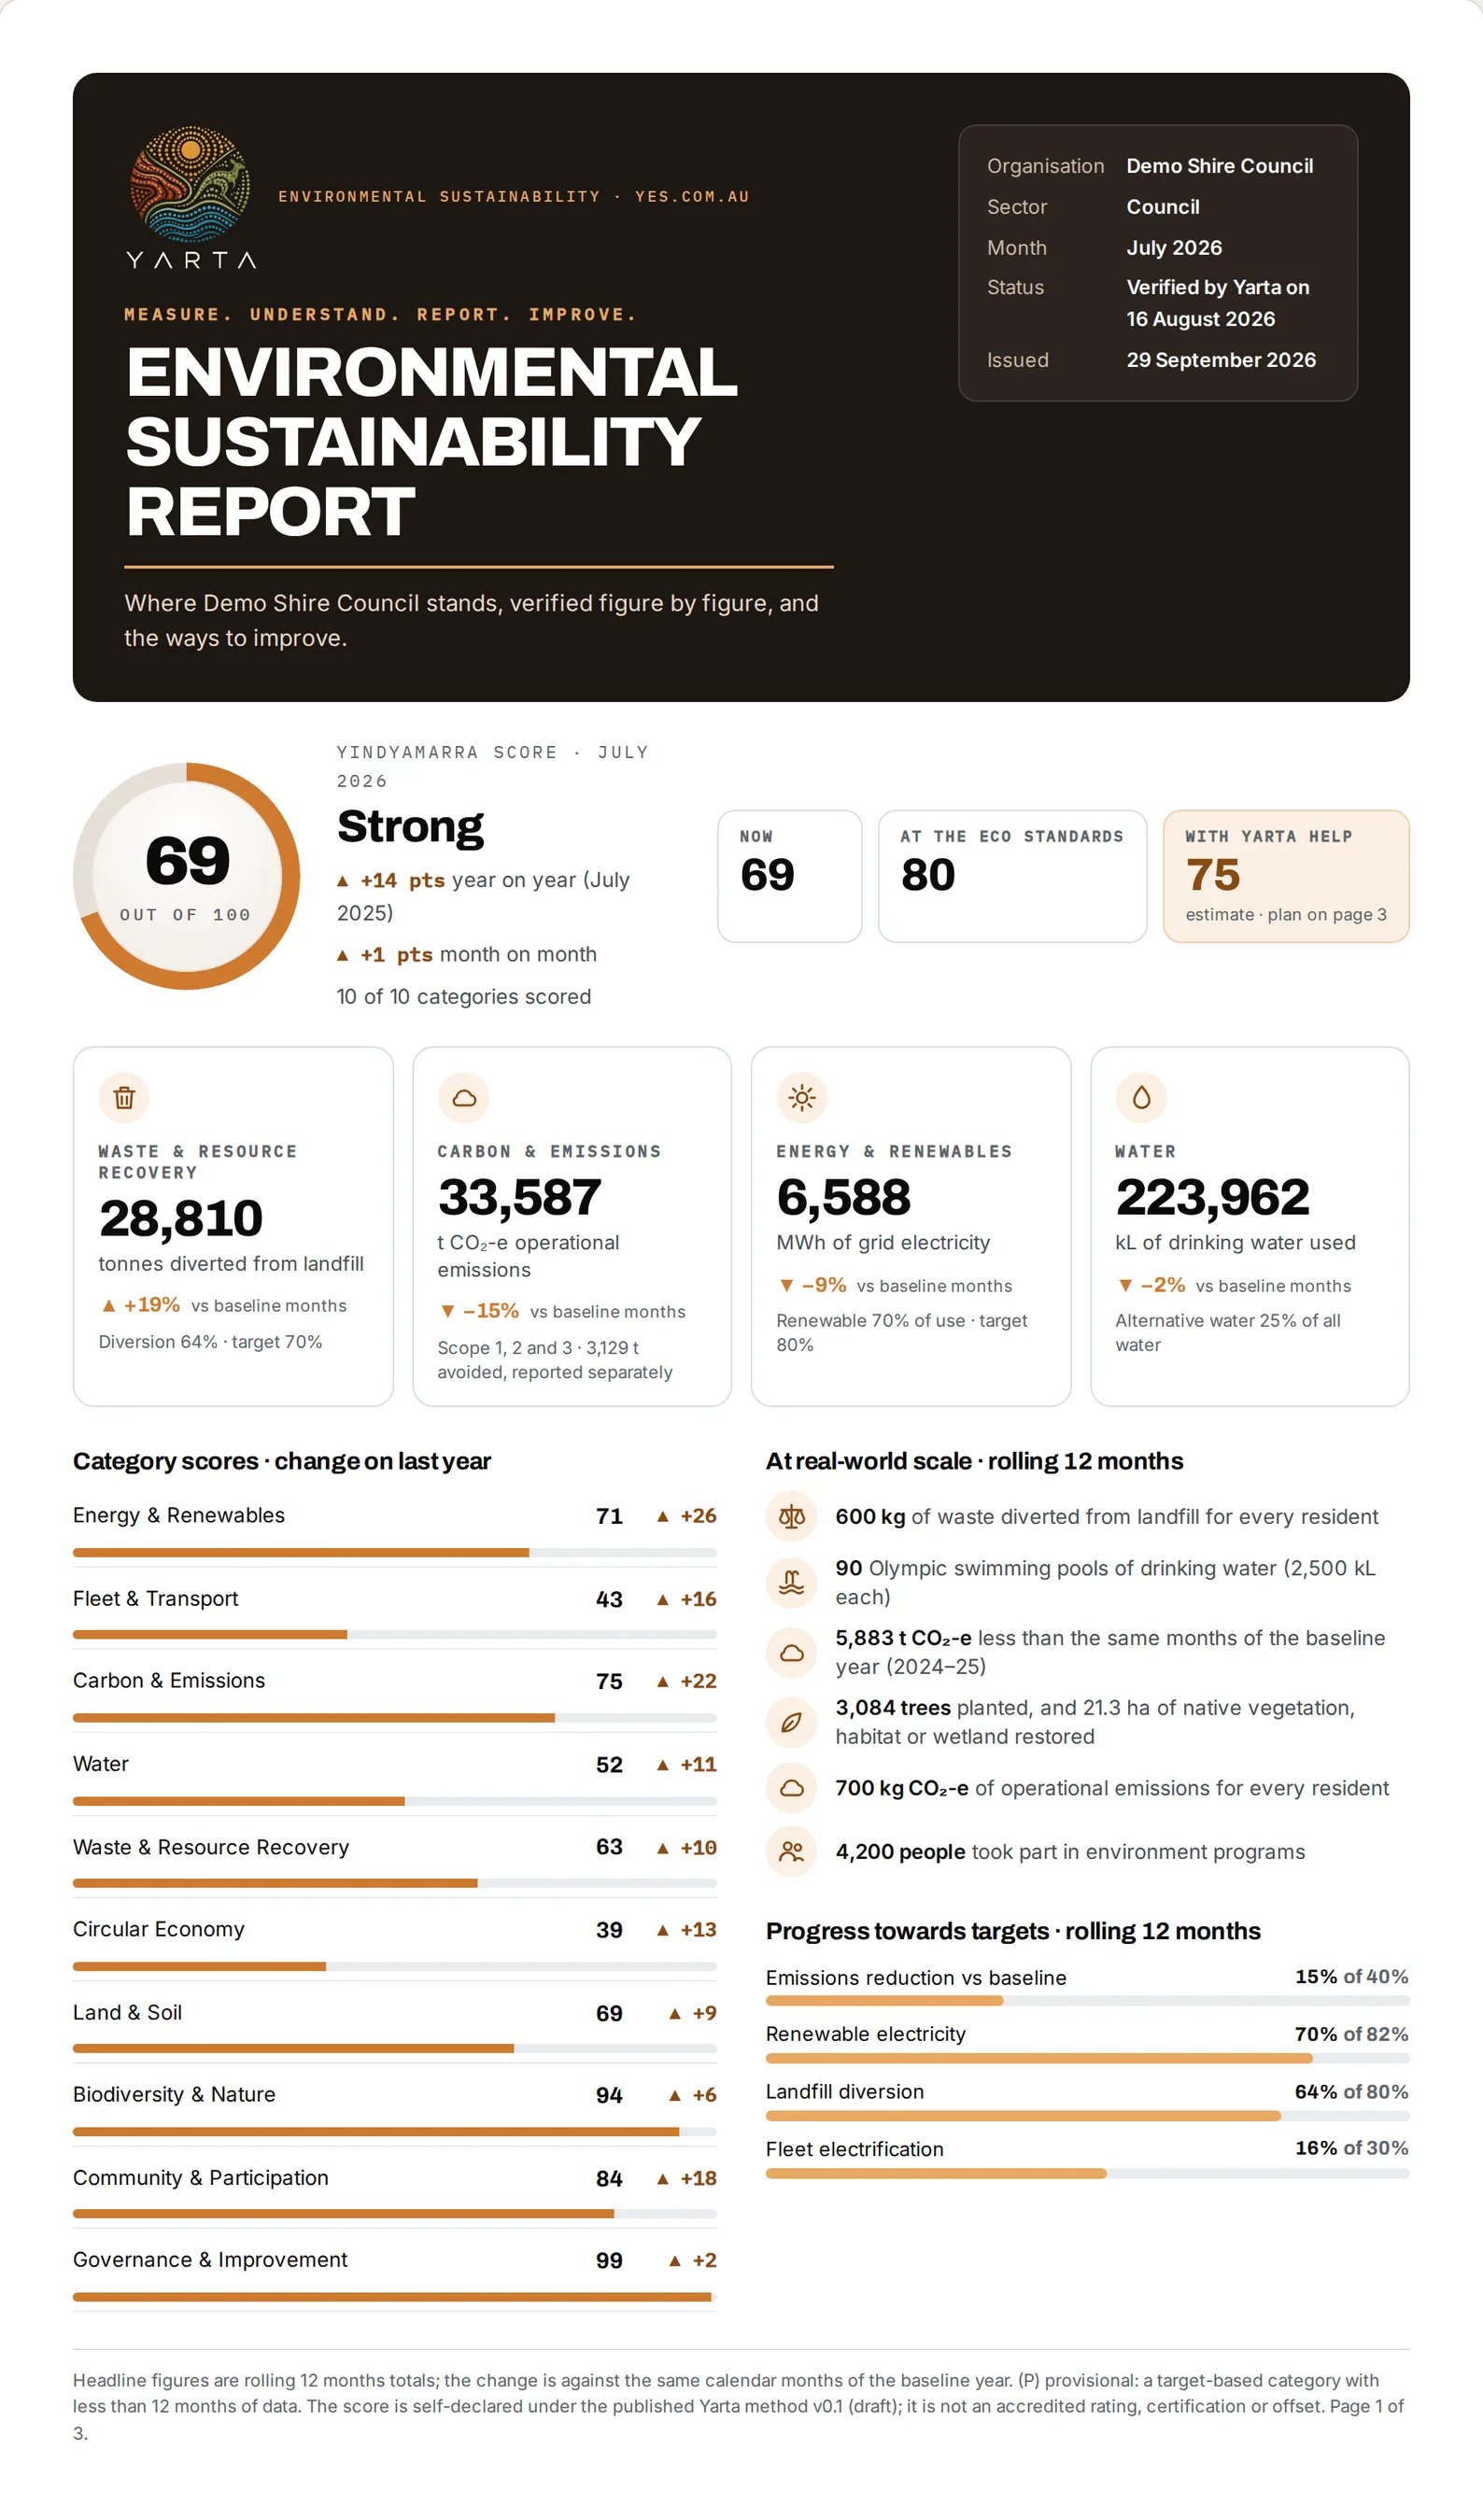
THE Yarta REPORT
Demo data · illustrativeEvery figure carries its factor, its source and its method version.
Claims such as trees saved make a nice picture. They do not survive an audit. A Yarta Report states the score and the ten category scores, the figures behind each, the emissions inventory with its NGA factors, and avoided emissions in their own box.
Three A4 pages. The score and where you could be, the headline figures, the categories and the eco standards, then the figures behind the score, then the roadmap to improvement, with method version, issuer and report ID. An assurance provider can follow any figure on it back to the record it came from.
See a sample report →Marketing-based
- Trees saved
- Black balloons
- A single diversion percentage
- Self-reported, with nothing behind it
- No method
Evidence-based (Yarta)
- Ten categories, each with its rule stated
- Inventory and avoided emissions, kept apart
- Every category against an eco standard or your target
- Entered and evidence-graded by Yarta
- Every line traceable to a record
Multi-site
Sites, regions and the portfolio, from one record.
Every entry is tagged to a site. Roll it up by region or read the whole portfolio, with the method held constant across all of it.
A national operator does not operate in one place. A distribution centre runs a fleet and hands over pallets and film, a head office buys the electricity and refreshes its IT, a depot uses the water and clears the scrap. Yarta holds each of them as a site with its own record, and reads them together as a portfolio.
The monthly fill-in-the-gaps email goes to each site, so the person who knows where the material went is the one who answers.
- Per site. Its own score, category tiles, monthly gap email and Yarta Report per period.
- Per region. Sites grouped the way your organisation is run, with the same tiles at the regional level.
- Portfolio roll-up. One Yindyamarra Score and one set of tiles for the whole organisation, built from the site records.
- Yarta Benchmark. Compares sites against each other, against their previous period, and against the eco standards and the industry benchmark for your sector, and shows which categories moved the number.
Pricing for business
Set by staff numbers.
An annual subscription, priced by the month. No per-report charges. The establishment fee is waived for Foundation Members who join in the first 12 months.
The establishment fee is normally $5,000 to $15,000 and covers scoping, sites and streams, the baseline, the method sheet and onboarding. Foundation Members who join in the first 12 months pay none of it.
The subscription is annual, priced by the month, and applies from the switch-on date. Any work the roadmap recommends, from a solar installer to a waste contractor, is contracted separately with the accredited provider you choose.
Annual subscription, priced by the month
- Yarta Dashboard for your sustainability team
- Every category entered and evidence-graded by Yarta
- Monthly gap email per site
- Yarta Report per site and period
- Multi-site reporting
- Scope 1, 2 and 3 carbon export
- CSV and PDF exports
- Roadmap to improvement, updated each quarter
- Named Yarta data operator
- Switched on in 30 days
Establishment fee normally $5,000–$15,000. Waived for Foundation Members in the first 12 months.
Questions business asks
What you will want to know first.
The questions sustainability, procurement and finance teams ask first.
Can our existing suppliers' data be included?
Yes. Yarta reports the whole organisation, whoever supplies it. Figures from your electricity retailer, fuel-card provider, water utility, waste contractors and landscapers are entered and graded by the evidence behind them. A bill, meter read, processor certificate or weighbridge record counts in full. A contractor report counts and is flagged. A statement with no documentation is recorded and does not count until the evidence arrives.
Who enters the data?
You enter the figures; Yarta verifies them. Your named Yarta data operator enters every figure against the bill, statement, certificate, invoice or contractor record you supply, and grades its evidence. That is what lets the figures hold up in front of an assurance provider.
What do we receive each month?
The fill-in-the-gaps email for each site, listing every category and stream we have and every one we cannot yet account for. Once your answers are entered, the dashboard is current, the score is updated and the month's figures are ready to export. A Yarta Report issues at the end of each reporting period, with the roadmap to improvement for the next one.
Can we get the underlying data?
Yes. Yarta Data exports as CSV: every entry with its date, site, category, stream, quantity, evidence grade, evidence reference and the operator's initials. The carbon export adds the scope, factor, source and method version for each line.
Who are we benchmarked against?
The eco standards first: the national targets for waste recovery, emissions and renewable electricity, and your own targets where no national standard exists. Then the published industry benchmark for your sector, drawn from public sources such as NABERS, NGER and industry reports, never from other Yarta customers. Your data is not shared with any other organisation, and no other organisation's data is shown to you.
Is this an offset?
No. Yarta reports two figures: your emissions inventory by scope, and the emissions recycling avoided, reported separately under a stated method. It does not issue offsets or credits. The avoided figure is never deducted from your inventory and should not be presented as an offset, a credit or a carbon-neutral claim.
More answers: questions we are asked · Yarta and the alternatives · what we will ask you for · glossary.
Switched on in 30 days
See your Yarta impact before you commit.
Book a 30-minute walkthrough with the demo dashboard, or enter one month of your figures and see what Yarta makes of them.