Measure. Understand. Report. Improve. Shaping Country for tomorrow.The YARTA story

Environmental Impact Intelligence

Measure. Understand. Report. Improve.

Yarta is an environmental sustainability report and live dashboard for councils and businesses. It evaluates your data against the eco standards and the benchmarks for your industry, compares it with your targets and your last period, then gives you a roadmap to improvement: practical suggestions, ranked by what would move the number, and accredited help you can book. Where your material passes through Recycle Group, the recycling line is evidenced by the recycler.

Yarta DASHBOARD · Demo Shire CouncilDemo data · illustrative
0
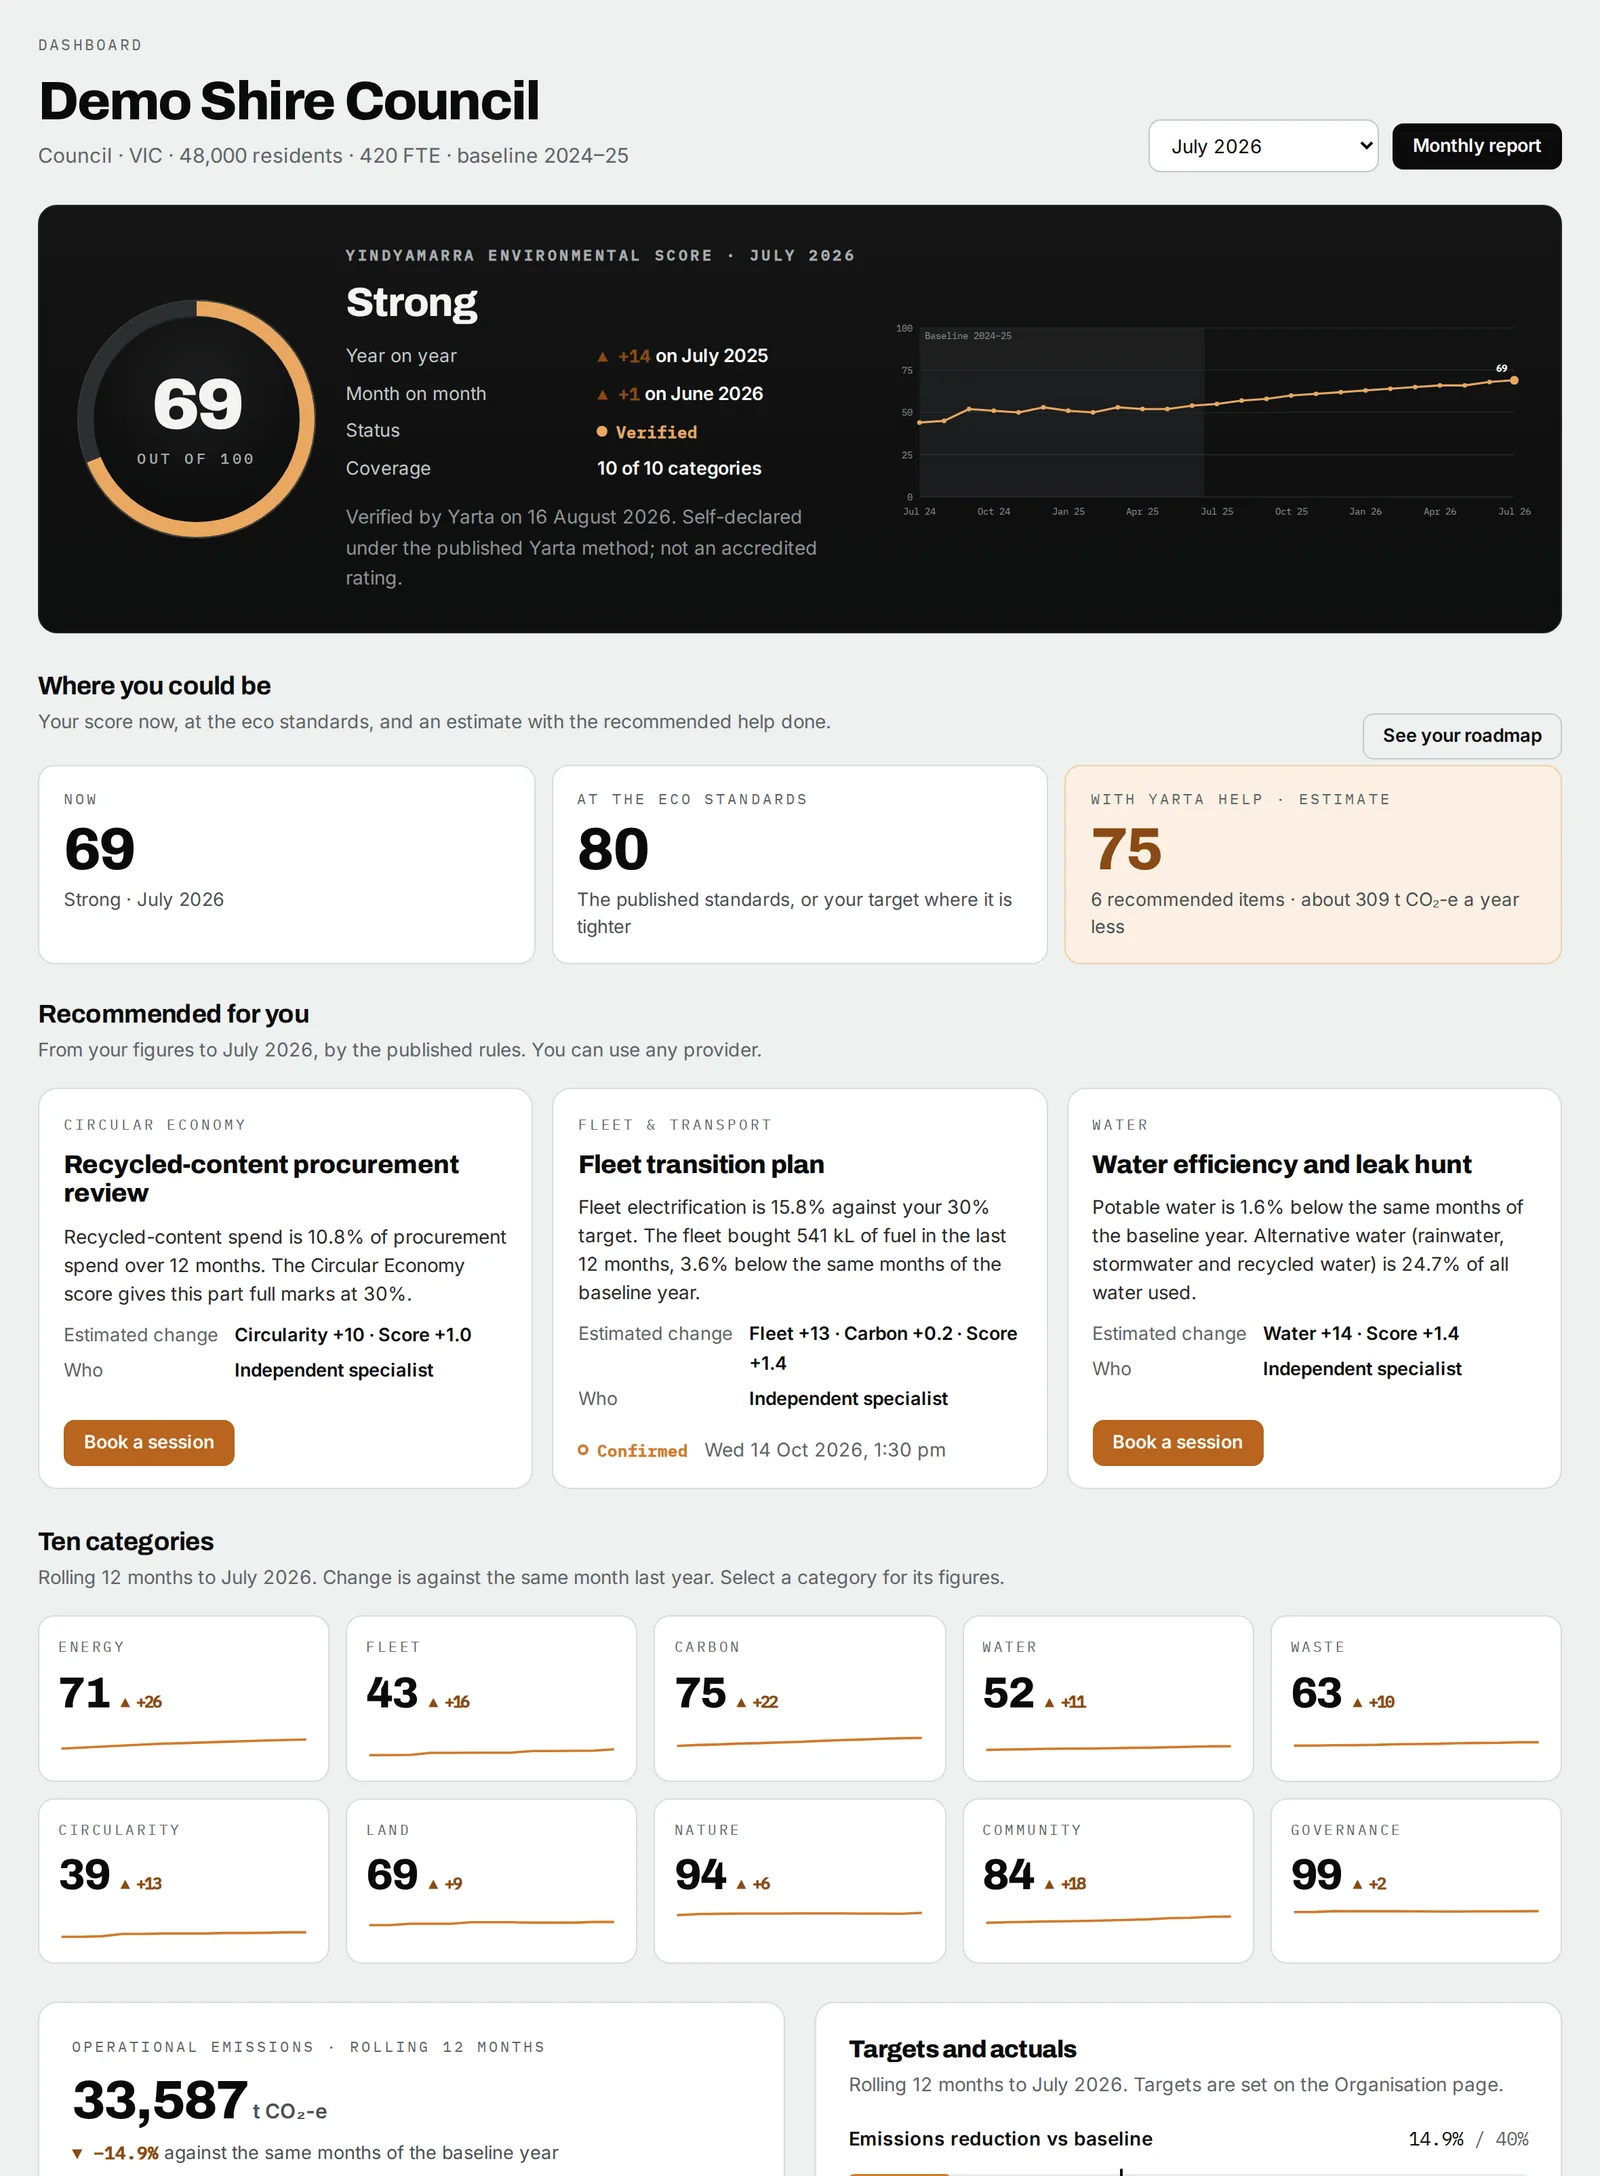
Yindyamarra Score
 
0
At the eco standards
where you could be
0
With Yarta help
estimate, from the roadmap
0t
Emissions, 12 months
 
EffectRoadmap suggestionCategory

Live demo · illustrative dataOpen the demo →

The YARTA story

Four elements. One purpose: shaping Country for tomorrow.

YARTA is built around a simple belief: the future of Country is shaped by what we do today. Our logo brings together four ideas, Country, water, sun and tomorrow, as one connected symbol.

Country

At the centre of YARTA is Country: living, connected and constantly changing. The decisions we make about resources, waste and materials become part of that story. YARTA exists to help organisations understand those decisions, and make better ones.

Water

The flowing forms are water: movement, connection and continuity. Materials move through our communities the way water moves through the landscape. YARTA makes that movement visible.

Sun

The sun is energy, life and renewal: the opportunity within every environmental decision. Waste isn't simply an end point. Every outcome is an opportunity to do better.

Tomorrow

The animal is movement towards tomorrow: progress that moves forward with Country, not away from it. Tomorrow isn't something we simply arrive at. We shape it.

Country. Water. Sun. Tomorrow. A connected system, just as environmental impact is connected across every stage of the resource journey. Read the full YARTA story →
01

What you get

A report to hand over. A dashboard that keeps moving. A roadmap to improvement.

The report and the dashboard are built from the same record and state the method version they were calculated with. The report closes with the roadmap: the benchmark, the suggestions and the plan by quarter.

Yarta Dashboard for a council hard waste program, showing the Yindyamarra Score, six headline tiles and the two emissions figures side by side (demo data)
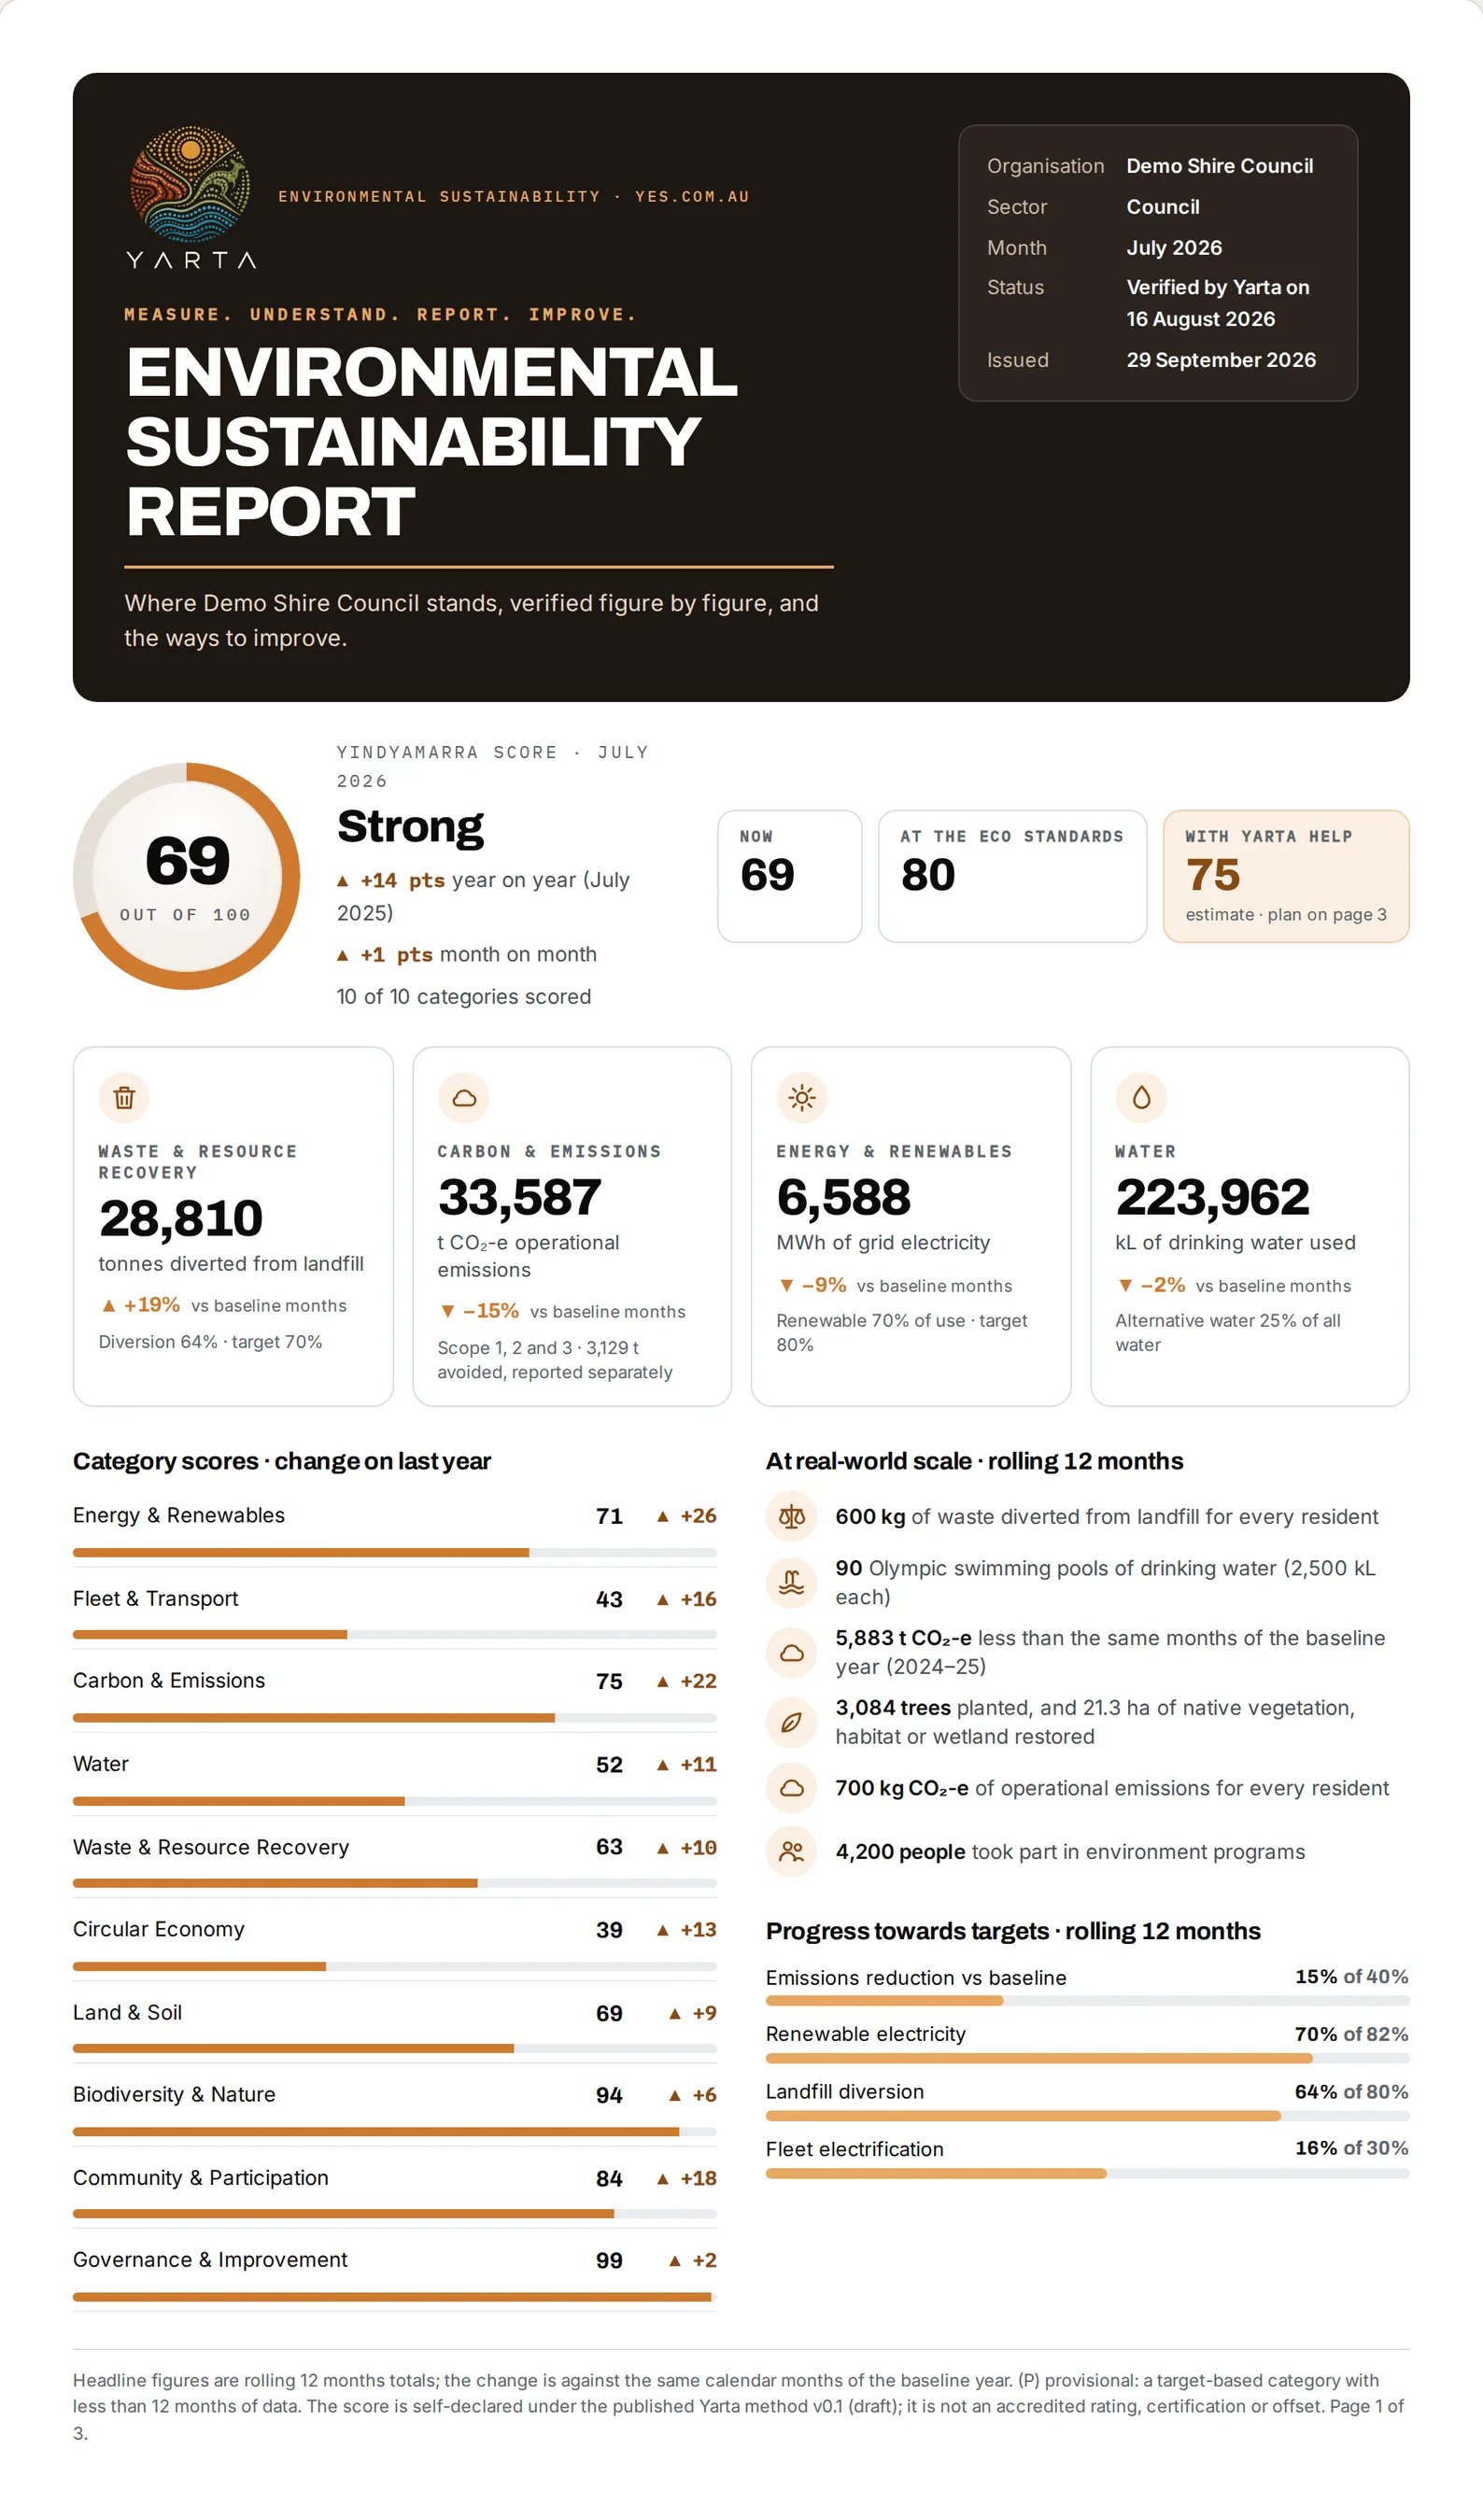
Yarta Report, page one: the Yindyamarra Score, where you could be, four headline figures, the ten categories and progress towards the eco standards (demo data)
01

Yarta Dashboard. The live layer.

Your score, the ten categories, where you could be at the eco standards and the suggestions, live, across every site. It moves the month the data lands. For material that passes through Recycle Group, the waste category rests on the recycler's own records.

Open the live demo →
02

Yarta Report. The layer you hand over.

Issued for each reporting period. Three pages a board, a councillor or an auditor can read: the score and the ten categories, the eco standards and the industry benchmark, the figures behind the score with their evidence grades, and the roadmap to improvement. Every figure carries the method version it was calculated under.

See the sample report →

01

Evaluate.

Send the data you already hold. You enter it in your portal, Yarta verifies it, grades the evidence and evaluates it against eco standards with one documented method.

02

Benchmark and compare.

One score, benchmarked against the eco standards and the published benchmarks for your industry, and compared with your targets and your last period. Your data is never shared with anyone else. A report for each period and a dashboard that moves as your data arrives.

03

Roadmap to improvement.

Suggestions ranked by what would move the number most, the score you could reach, and the help you can book to get there.

Why believe the number

The recycling line is evidenced by the recycler.

Yarta is a Recycle Group initiative, and the group runs the recovery operations. For material that passes through them, the waste category on your report rests on the processor's own weighbridge and processing records, not a contractor's summary. Every other category rests on your bills, meters and registers, graded the same way.

01

Weighed where it was recovered.

Incoming material is separated into more than 90 streams at the group's transfer station, so each stream can be weighed and traced to a pathway, with the certificate to show for it.

02

The top tier of Scope 3 evidence.

The GHG Protocol ranks supplier-specific data, the processor's own allocated energy per tonne, above waste-type and average factors for Category 5. A recycler that also writes the report can supply it.

03

Graded, never assumed.

Material handled by any other contractor is reported too, graded by the evidence behind it and flagged on the report, so a reader can always see what a figure rests on.

02

The problem

The data is scattered. The score doesn't exist. The plan is a guess.

Bills, fuel cards, contractor reports, fleet registers, planting records. Every organisation holds the data and almost none can say where it stands against the eco standards, what would move the number, or what to do first.

Recycling has been sold as a collection service and reported as a percentage. It should be a measurable outcome.

Recycling reporting today

  • A tonnage line on an invoice
  • A diversion percentage
  • A claim nobody can trace
  • Different numbers from every contractor
  • Nothing a resident or a board can picture

With Yarta

  • Every handover entered and verified by Yarta
  • A report per project or period
  • A dashboard that moves the day material moves
  • One documented method for every calculation
  • Numbers that survive an audit
03

Understand

Ten categories. One score.

The Yindyamarra Score is the average of the categories you report. Each one is scored 0 to 100 against the eco standard or your own target, from the figures behind it. A category you don't report is left out, not scored zero.

Energy & Renewables

Electricity, gas, solar and batteries. Renewable share and use against your baseline.

Fleet & Transport

Fuel, kilometres, electrification, charging and flights.

Carbon & Emissions

Scope 1, 2 and reported Scope 3 with NGA factors. Avoided emissions shown separately, never netted.

Water

Potable use per bed, student, site or resident, and the share from recycled, rain and stormwater.

Waste & Resource Recovery

Every stream, from kerbside to clinical: recovered, landfilled or treated. Diversion and contamination.

Circular Economy

Recycled-content procurement, reuse, packaging and take-back programs.

Land & Soil

Land rehabilitated, contaminated land remediated, soil reused.

Biodiversity & Nature

Trees planted and native vegetation, habitat and wetland restored or protected.

Community & Participation

Programs, events and the people who take part.

Governance & Improvement

Data completeness, evidence behind each figure, complaints closed, projects delivered.

04

Roadmap to improvement

Where you are. Where the standards would put you. What to do first.

Every report closes with three numbers and a plan by quarter. The suggestions come from published rules applied to your own figures, ranked by what would move the number most, and each one can be booked with a provider who holds the accreditation the work requires. The next report shows what changed.

Now—
At the eco standards—80% recovery, 82% renewables, or your tighter targets
With Yarta help · up to—

Demo Shire Council is fictional. The estimates come from the published assumptions on the method page; they are not a promise. Any work delivered by a Recycle Group business is disclosed on the report.

05

Sectors

The same ten categories, shaped by what your sector reports.

A hospital leads with energy per bed and clinical waste. A transport operator with litres per 100 km and tyres. A council with the kerbside service and Country. Pick a sector and the demo and the sample report change with it.

06

Your data

Your data in. Your results out. Then the roadmap.

You enter the figures you already hold, in a question set shaped for your industry. Yarta verifies them, grades the evidence behind each one and calculates the score, the figures and the two emissions figures with one documented method. Then it shows where your targets would put you and what to do next.

YOUR QUESTION SET

Enter what you have.

Once a month your portal asks for the figures your industry reports: fuel, electricity, gas, water, waste by stream, the registers. Last year's figure sits beside each box, so most of the form is confirm or change. Attach the bill if you have it and the figure earns a higher evidence grade.

EVIDENCE GRADES

Every figure carries its record.

A bill, a docket, a certificate or a contractor report is Grade A. A statement or an extract is Grade B. An estimate is Grade C and says so. Nothing is averaged and nothing is netted off.

THE Yarta METHOD

One documented method.

Every factor has a source, a status and a version. The Category 5 inventory uses the government's NGA landfill factors. Avoided emissions use NSW DECCW 2010 factors, flagged for refresh and reported separately. Assumptions are labelled as assumptions until measured data replaces them.

Read the Yarta Method →
  1. Enter your figures

    A month of fuel, energy, water and waste figures from your own records, for the whole organisation or site by site, in your industry's question set.

  2. Yarta verifies and calculates

    A Yarta analyst checks every figure against your earlier months and the benchmarks, asks if something looks off, grades the evidence and runs the published method.

  3. The dashboard moves

    Tonnes by fate, steel, landfill avoided and both emissions figures update for the stream, the program and the whole organisation.

  4. The report issues, with a roadmap

    At the end of the period, a Yarta Report: the score, the benchmark, the figures, the method version, and the roadmap to improvement with its suggestions.

07

Who it's for

Councils and businesses. One standard.

Built for the organisations that carry the reporting obligation and rarely hold the evidence, whichever sector they sit in.

Yarta Dashboard for a council hard waste program (demo data)

COUNCILS

Demo data · illustrative

Hard waste, kerbside and transfer stations.

Report every program on one dashboard, issue a report for each period, and put a docket-backed number in the next tender instead of a contractor's estimate.

$1,999 a month, councils up to 50,000 residents · Annual subscription · Switched on in 30 days

Yarta Report, page one (demo data)

BUSINESS

Demo data · illustrative

ESG, Scope 3 and the annual report.

Ten categories with a documented method behind every figure: Scope 1, 2 and 3 emissions for your inventory, avoided emissions reported separately, the industry benchmark for your sector, and the evidence trail an assurance reviewer will ask for.

From $999 a month, by staff numbers · Annual subscription · Switched on in 30 days

USED FOR

Environmental reportingSustainability reportingESG reportingProcurement reportingWaste and recycling targetsCircular-economy initiativesInternal environmental KPIsCustomer and stakeholder reportingAnnual sustainability reportsSupplier performance reporting

Mandatory climate reporting

Scope 3 is reported now, and an auditor reviews it.

Large companies are in their first Scope 3 year. Mid-sized companies start reporting from 1 July 2027. Waste is Scope 3, Category 5, and Yarta gives you that number from the processor that handled the material: the top tier of evidence the GHG Protocol allows.

  1. Group 1 · $500m+Scope 3 year running nowJune year-ends: 1 July 2026 to 30 June 2027
  2. Group 2 · $200m+Scope 3 from 1 July 2027Reporting for years starting on or after 1 July 2026
  3. Group 3 · $50m+Reporting from 1 July 2027Scope 3 the year after, where climate risks are material
08

Built on real recovery

The numbers come from a processor, not a spreadsheet.

Yarta is a Recycle Group initiative. The group runs the recovery operations, including The Mattress Recycling Company, so the figures on a Yarta Report come from the floor that recovered the material.

0
Mattresses a month, upper range
The Mattress Recycling Company processes between 12,000 and 30,000 a month. Each one takes about 38 seconds.
0%
Steel recovery · stated plant yield
$8.5m invested to get there. Roughly 30% of a mattress by mass is steel, and Recycle Group states 99% of it comes back out. Each report prints the measured yield with its site and study date.
0+
Streams separated on site
Incoming material is separated into more than 90 streams at the group's transfer station, so each one can be weighed and traced.
0
Streams reported
Mattresses, steel, aluminium, timber, tyres, white goods, e-waste, textiles, rubble, vehicles, green waste and general rubbish, each with its own recovery path and factor.

ISO 9001:2015 · ISO 14001:2015 · ISO 45001:2018 · NIST 800-88

$0
Maximum saving · establishment fee waived

Foundation Members

Free to join in the first 12 months.

The Yarta establishment fee is normally $5,000 to $15,000. Foundation Members who join in the first 12 months pay none of it. The annual subscription applies from the switch-on date.

Switched on in 30 days

See your Yarta impact before you commit.

Book a 30-minute walkthrough with the demo dashboard, or enter one month of your figures and see what Yarta makes of them.